No. 40 Studies on the selectivity for complex formation of saturated and unsaturated fatty acid triglycerides with α-Cyclodextrin
Summary
α-Cyclodextrin (α-CD) is a beneficial dietary fiber to reduce blood glucose level,neutral fat level and also body weight.
It was reported that α-CD administration is effective to increase saturated fats selectively in fecal excretion compared with unsaturated fats1).
Therefore, we investigated the complex formation selectivity of saturated and unsaturated fatty acid triglycerides with α-CD.
Tristearin was selectively complexed with α-CD from the mixture of tristearin and triolein.
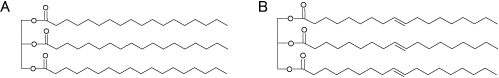
A : Tristearin (TS) / B : Triolein (TO)
1) D. Gallaher, C. Gallaher, D. Plank, Alpha-cyclodextrin selectively increases fecal excretion of saturated fats, FASEB J;21:A730 (2007)
Background
Alpha-Cyclodextrin Selectively Increases Fecal Excretion Of Saturated Fats
Daniel D. Gallaher, Cynthia M. Gallaher, and David W. Plank
Experimental diet
Male Wistar rats, 125-150 g in initial weight, 10 per group, were fed with one of four diets upon arrival. All diets contained 15% fat by weight.
The diets were as follows :
- Control - AIN-93G + cellulose 5%
- Chitosan - AIN-93G + chitosan 5%
- α-CD - AIN-93G + α-CD 5%
- Complexed α-CD - AIN-93G + α-CD 5% (lipid and 5%α-CD complexaton)
AIN:American Institute of Nutrition
Experimental design
Rats were fed with their respective diets for 7 days. Then the animals were fasted overnight, and presented with a 5 g meal of their respective diets containing 14C-triolein and 3H-tripalmitin incorporated into the lipid.
A fecal collection was started four hours later, and was continued 12 hours.
Result
Cyclodextrin appears to selectively increase saturated fat excretion.
Experimental design following Szejtlis' method2)
2) J. Szejtli, E. Bánky-Előd, Á. Stadler, Enrichment of the unsaturated components in fatty acid ester mixtures by cyclodextrin complex formation, Acta Chimica Academiae Scientiarum Hungaricae, Tomus, 99 (4), 447-452 (1979)
Analytical method
Differential scanning calorimetry (DSC) analysis
DSC analytical condition
equipment : DSC-60 (SHIMADZU)
temperature : 50℃-100℃ (10℃/min)
Triglyceride (TG) analysis
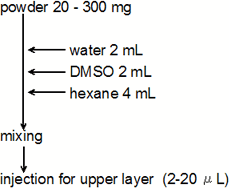
sample preparation
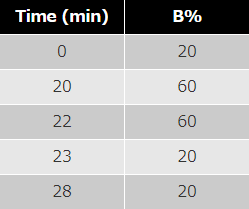
HPLC analytical condition
system : LC-2010C (SHIMADZU)
column : Luna 5μ C18(2) 100 A, 4.6 mm I.D. x 150 mm (Phenomenex)
temperature : 40℃
flow rate : 1 mL/min
mobile phase : A; acetonitrile B; THF
program :
Evaporative Light Scattering Detector (ELSD) analytical condition
system : ELSD-LT II (SHIMADZU)
nebulizer gus : N2
N2 pressure : 360 kPa
temperature : 50℃
gain : 11
Pre-test (selection of dispersion solvent for TG)
Purpose
selection of dispersion solvent for TG in aqueous α-CD solution
Experiment 1 selection of organic solvent
After adding various organic solvent to 10% aqueous α-CD solution, the sample was observed visually.
Experiment 2 TG solubility test by organic solvent
After adding various organic solvent to TS and TO mixture at 70℃, the samples were observed visually.
Results
Only ethyl acetate sample formed clear liquid (Fig. 3-A).
Ethyl acetate could dissolve TS and TO mixture at 70℃ (Fig. 3-B).
These results showed that ethyl acetate was proved useful.
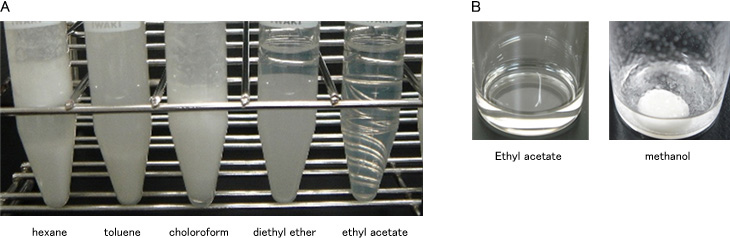
A : selection of organic solvent / B : TG solubility test by organic solvent
Pre-test (selection of washing solvent for TS adhered to TS-α-CD)
Purpose
selection of washing solvent for TS adhered to TS-α-CD
Experiment
- TS-α-CD(TS 30w/w% contained) was prepared by conventional method.
- After washing TS-α-CD with various organic solvent, the TS-α-CD was analyzed using DSC.
Results
- DSC analysis of TS-α-CD before washing showed endothermic peak derived from the melting point of TS (Fig.4 red line).
- The endothermic peak of TS disappeared by THF washing.
- And TO was dissolved easily in THF (data not shown).
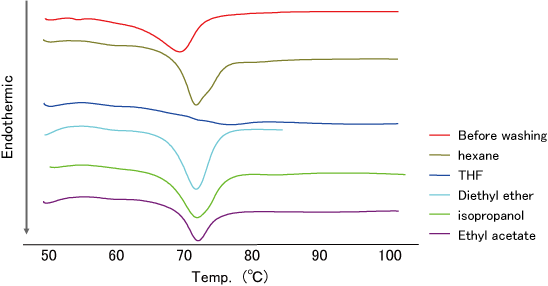
The result showed that THF has washing capability for TS adhered to TS-α-CD.
Pre-test (THF Washing test for TS adhered to TS-α-CD)
Purpose
Washing effect with THF on TS adhered to TS-α-CD
Experiment
After washing TS-α-CD with THF one time or more, the TS-α-CD was analyzed using DSC and HPLC-ELSD.
Results
- DSC analysis was performed for washing evaluation for TS adhered to TS-α-CD. HPLC-ELSD analysis was performed for the evaluation of TS content in TS-α-CD. DSC analysis showed that the endothermic peak derived from the melting point of adhered TS disappeared washing with THF 2 times (Fig. 5-A). This result means that TS adhered to TS-α-CD disappears by washing 2 times.
- HPLC-ELSD analysis showed that there was no difference in TS content in TS-α-CD by 3 times washing compared with 2 times washing (Fig. 5-B).
- This result means TS content in TS-α-CD comes not from adhered one, but from encapsulated one, that is, no adhered TS remains.
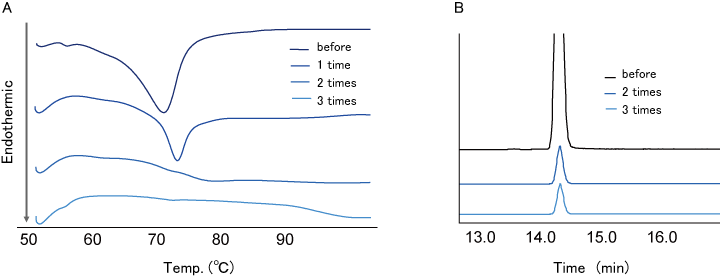
The result showed that THF washing remove adhered TS, but does not remove TS encapsulated in α-CD.
Complex formation selectivity test for TG with α-CD
Purpose
investigating the complex formation selectivity of saturated and unsaturated fatty acid triglycerides with α-CD
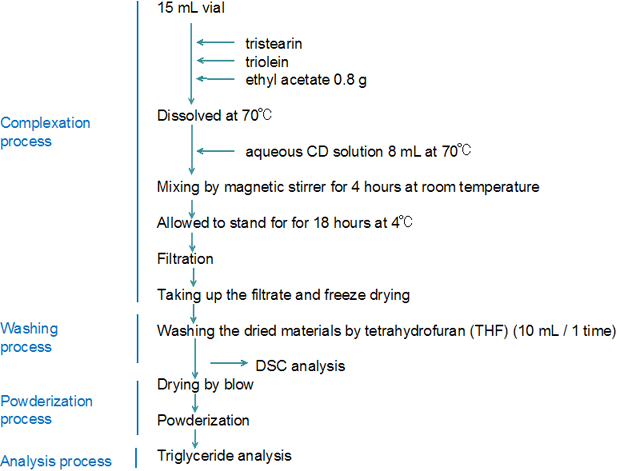
Experiment
- Experimental method was shown in the slide of "Experimental design".
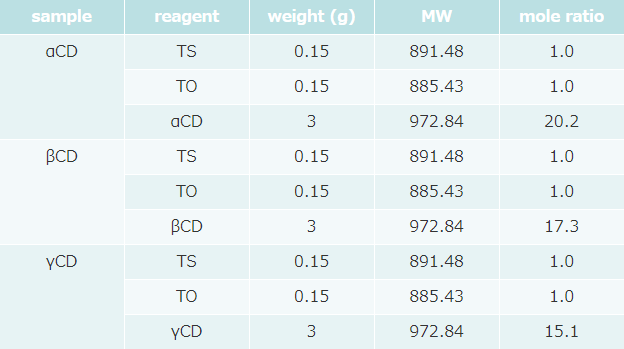
- Formulation was as follows (table 1).
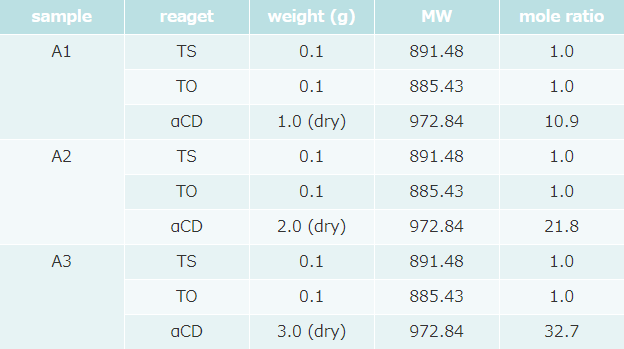
α-CD concentration of 3 samples was different.
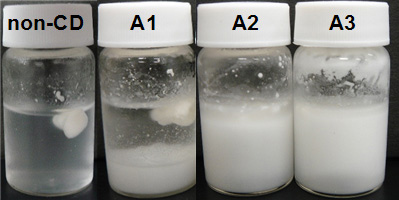
Appearance of TG and α-CD mixture
(after 18 hours standing at 4℃ during complexation process)
- Aggregating and floating material with cream color was thought that it was not yet complexed oil. Precipitated or suspended material was thought to be the complex of oil with α-CD.
- That floating material was observed for all samples, but that amount of A3 sample was less than other samples (Fig. 6). This picture showed complex proceeds with α-CD addition.
TG analysis of TG-α-CD (A3 sample)
- The endothermic peak derived from the melting point of TS disappeared by washing TS-α-CD with THF 3 times (data not shown).
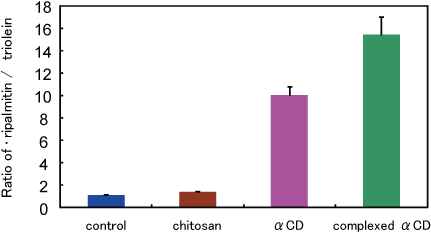
- After washing, the extract of A3 sample was analyzed using HPLC-ELSD. The content ratio of TS / TO in TG-α-CD was higher than that of original mixture (Fig. 7).
The result showed that tristearin was selectively complexed with α-CD.
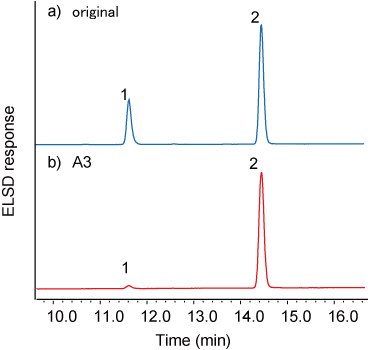
1 : TO / 2 : TS
Pre-test
(selection of washing solvent for TS adhered to TS-β-CD or TS-γ-CD)
Purpose
selection of washing solvent for TS adhered to TS-β-CD or TS-γ-CD
Experiment
- TS-β-CD and TS-γ-CD (TS 30w/w% contained respectively) was prepared by conventional method.
- After washing each TS-CD with various organic solvent, the TS-CD was analyzed using DSC.
Results
- DSC analysis of TS-β-CD and TS-γ-CD before washing showed the endothermic peak derived from the melting point of TS (Fig.8-A, B red line).
- The endothermic peak of TS-β-CD and TS-γ-CD disappeared by THF washing.
The result showed that THF have washing capability of TS adhered to TS-β-CD and TS-γ-CD.
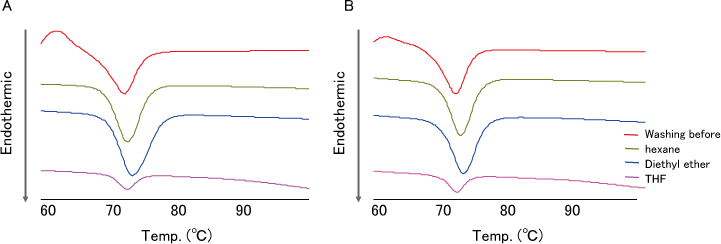
A : TS-β-CD / B : TS-γ-CD
Pre-test
(THF washing test for TS adhered to TS-β-CD or TS-γ-CD)
- DSC analysis showed that the endothermic peak derived from the melting point of TS disappeared by THF washing TS-β-CD (for 3 times, Fig. 9-A1) and TS-γ-CD (for 2 times, Fig. 9-B1).
- HPLC-ELSD analysis showed that TS content in TS-β-CD was reduced by THF washing 3 times or more (Fig. 9-A2). But TS content in TS-γ-CD was not reduced by THF washing 3 times (Fig. 9-B2).
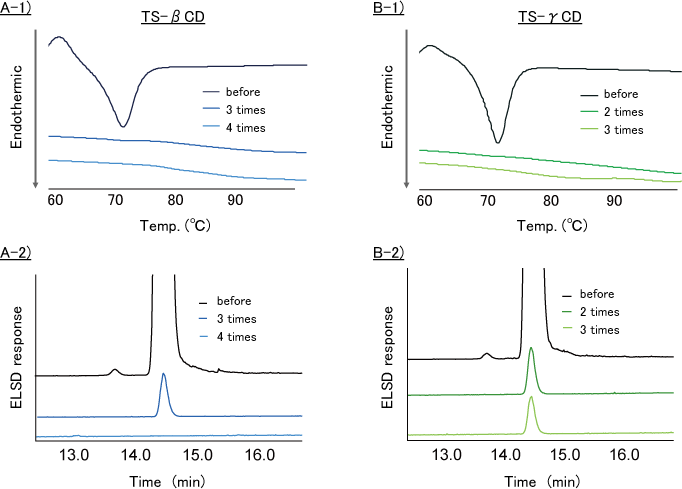
A-1 : DSC analysis of TS-β-CD / A-2 : ELSD analysis of TS-β-CD
B-1 : DSC analysis of TS-γ-CD / B-2 : ELSD analysis of TS-γ-CD
Complex formation selectivity test for TG with CDs
Purpose
investigating the complex formation selectivity of saturated and unsaturated fatty acid triglycerides with α-CD, β-CD and γ-CD
Experiment
- Experimental method was shown in the slide of "Experimental design" (except the amount of both water and ethyl acetate used 3 times more).
- Formulation was as follows (table 2).
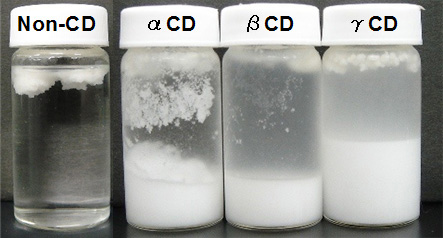
Appearance of TG-CD complex
(after 18 hours standing at 4℃ during complexation process)
Floating materials with cream color were observed for all samples, but that amount of CD added samples was less than that of non-CD sample (Fig. 10).
TG analysis of TG-CD
- The endothermic peak derived from the melting point of TS disappeared by THF washing each TS-CD (number of washing: α-CD was 7 times, β-CD was 4 times γ-CD was 4 times, data not shown).
- After washing, the extract of each samples were analyzed using HPLC-ELSD. The content ratio of TS / TO in TG-α-CD or TG-γ-CD was higher than that of original mixture (Fig. 11).
The result showed that tristearin was selectively complexed with α-CD and γ-CD.
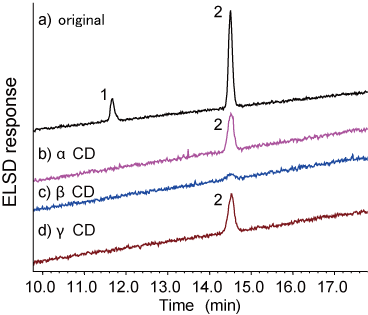
1 : TO / 2 : TS
Conclusion
Tristearin was selectively complexed with α-CD from the mixture of tristearin and triolein.